All posts tagged: Unsafe

InfoGraphic on the Good Grade Pills,

InfoGraphic on the Good Grade Pills

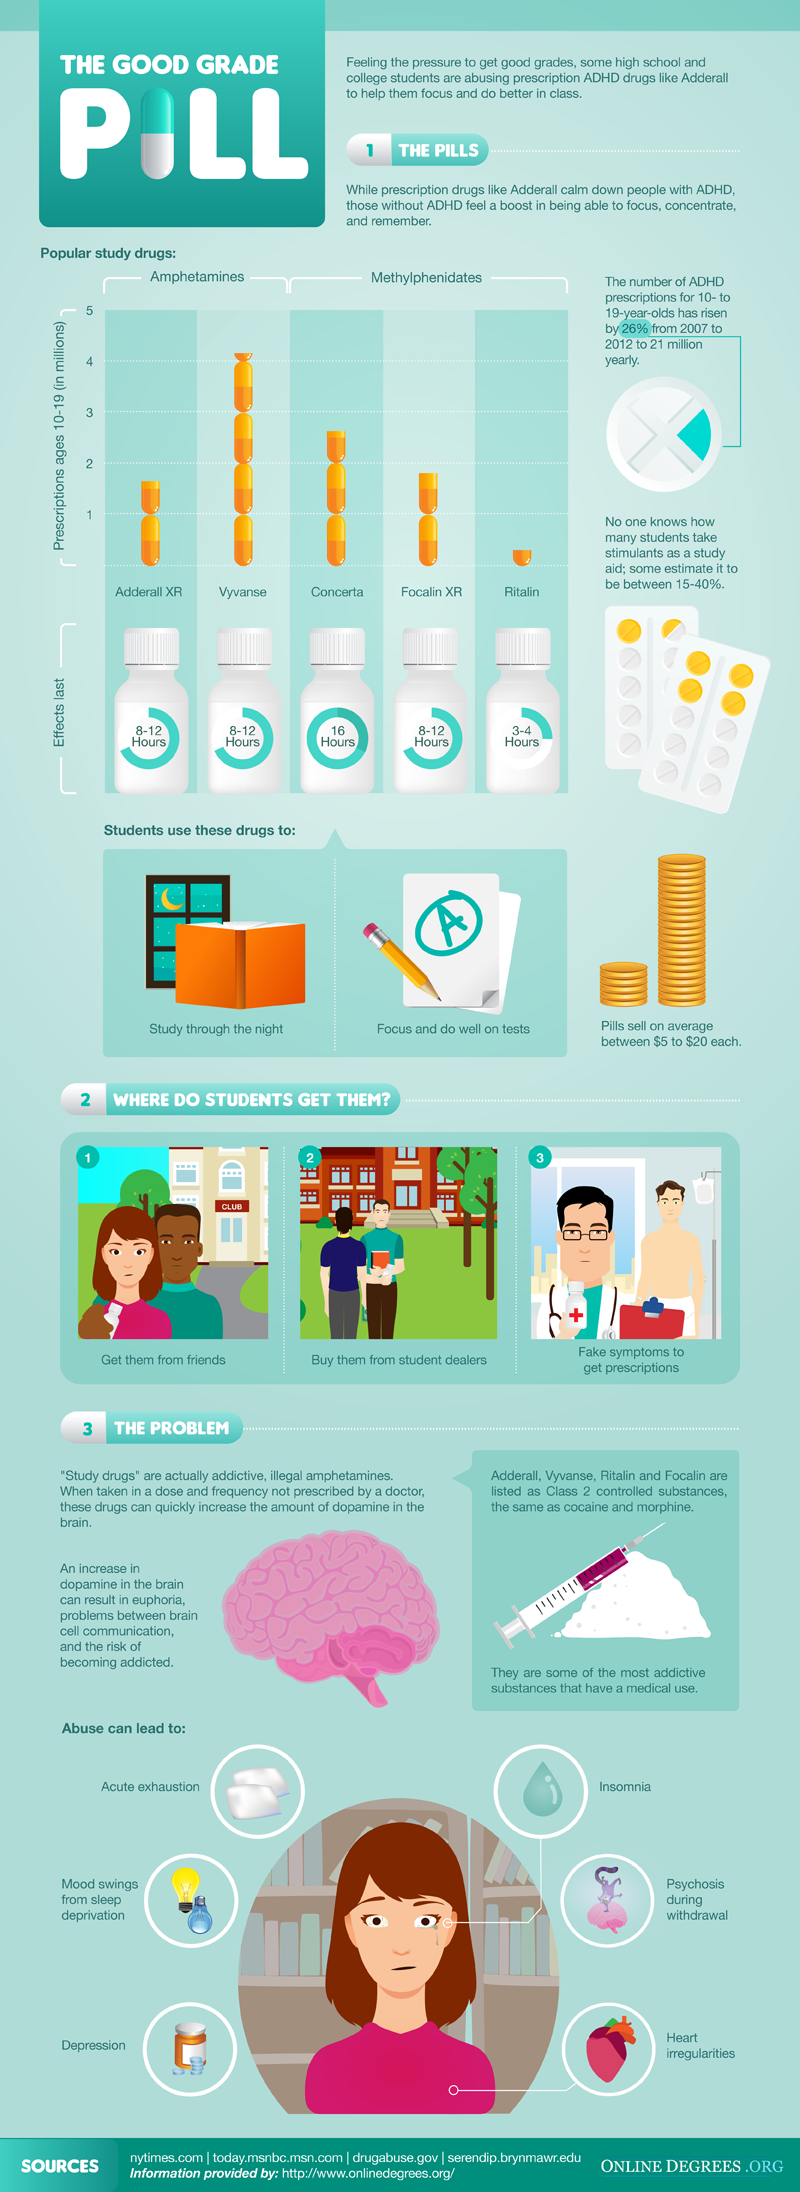
Many students are under pressure from peers, parents and maybe even financiers to do well in their studies, as the info graphic shows they will use stimulants to boost their performance. But these drugs can have harmful and dangerous consequences, so what do they do once they have used it and want to stop? One

InfoGraphic on the Evolution of Auto Safety,

InfoGraphic on the Evolution of Auto Safety

No matter how many massages you get, how much you meditate, or how many times you sit in an ozone pod, injuries from car accidents can and will harm you if the proper attention isn’t given to your safety and wellbeing. This info graphic shows how car safety progressed and what advanced safety technology is

InfoGraphic on Pet Fire Safety,

InfoGraphic on Pet Fire Safety

Wellness is a holistic view of one’s health and wellbeing, and here at Salvagente we address diets, relaxation therapies, health therapies like ozone sauna treatments, lifestyles and much more. Due to this holistic view, we are taking a look at pet safety, and for many people their pets are like family and will cause great

InfoGraphic on Workplace Fatality Data (US),

InfoGraphic on Workplace Fatality Data (US)

This info graphic indicates fatalities which happened while at work. Although the data is for the United States, it gives a clear picture to other countries that accidents at work is not an issue to be ignored. While prevention is the only only thing to do to stop fatalities, there’s a few options when it

InfoGraphic on Body Piercing healing time,

InfoGraphic on Body Piercing healing time

Decorating our faces (and many times the rest of our bodies) can have some serious medical drawbacks, not to mention the time it takes to heal. The most common of these complications is infection. Infection on any part of your body is painful, but because piercings often happen on sensitive areas of skin, the pain

InfoGraphic on Dirty Habits and Surfaces,

InfoGraphic on Dirty Habits and Surfaces

As this info graphic shows, our everyday environments are a lot more dirtier and hazardous to our lives than we think. Many times we can’t imagine where we got a cold from, but it can be from mobile devices, remote or even your own desk. Luckily many people found that an ozone sauna works effectively

InfoGraphic on Sugar Consumption,

InfoGraphic on Sugar Consumption

This info graphic paints a startling picture about our diets and the amount of sugar we consume. What is worse is the health risks refined sugar is linked to; obesity, high blood pressure, headaches and clogging of arteries just to name a few. It is important to monitor and reduce our daily intake of sugar,

InfoGraphic on the Greatest Human and Digital Viruses,

InfoGraphic on the Greatest Human and Digital Viruses

A look into viruses that infected millions and damaged or killed most of the infected is startling. What is concerning though is the way we safeguard our digital devices with preventative measures, malware detection, anti virus programs, but we do not take the same approach to preventing illness and infections to ourselves. Boosting your immune

InfoGraphic on Which drug causes the most harm,

InfoGraphic on Which drug causes the most harm

Although ALL drugs are harmful, some of these findings are surprising… These experts found that alcohols’ mean harm rating is more than LSD, and tobacco’s more than Khat. To successfully kick the addiction, it helps to get rid of all the toxins that lets you crave the drug. Effective means of this is through detoxification,

3D Representation of the Flu Virus,

3D Representation of the Flu Virus

You don’t always see the bacteria that makes you sick in such depth, with the breakdown of the different parts of the virus very informative. Winter is leaving South Africa, but colder days can be expected in Europe and America. If you haven’t given your immune system a boost yet now is the time to